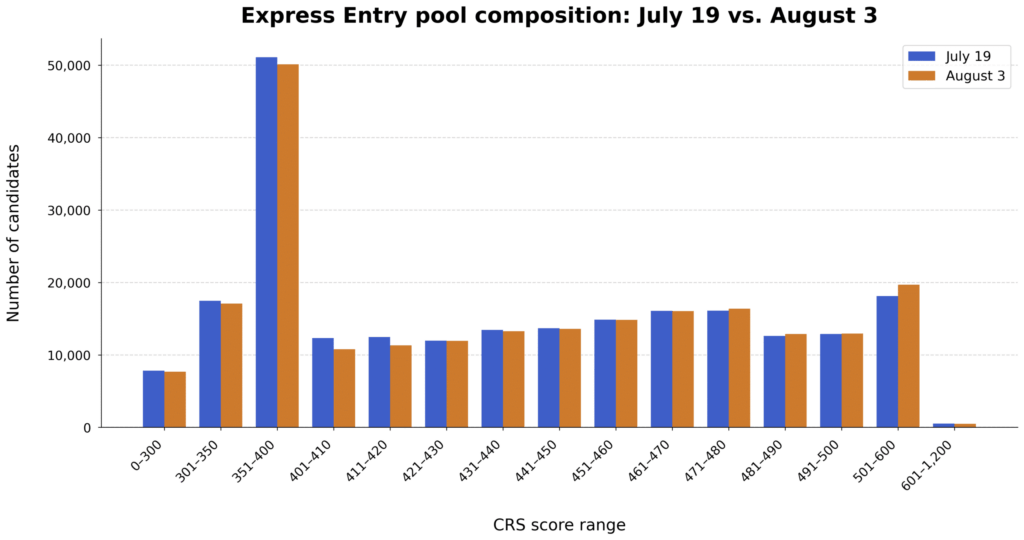
The immigration department released its latest snapshot of the Express Entry pool on August 3, showing a net loss of 2,433 profiles since the July 19 update. While the pool contracted overall, the number of candidates with CRS scores in the 501‑600 range grew by 1,572, and growth was recorded in almost every higher‑score band except the top tier.
Score‑range comparison (July 19 vs. August 3)
| CRS score range | August 3 | July 19 | Difference |
|---|---|---|---|
| 0–300 | 7,683 | 7,836 | –153 |
| 301–350 | 17,101 | 17,490 | –389 |
| 351–400 | 50,107 | 51,107 | –1,000 |
| 401–410 | 10,775 | 12,339 | –1,564 |
| 411–420 | 11,326 | 12,460 | –1,134 |
| 421–430 | 11,942 | 11,961 | –19 |
| 431–440 | 13,267 | 13,437 | –170 |
| 441–450 | 13,595 | 13,680 | –85 |
| 451–460 | 14,845 | 14,879 | –34 |
| 461–470 | 16,057 | 16,086 | –29 |
| 471–480 | 16,368 | 16,119 | +249 |
| 481–490 | 12,890 | 12,615 | +275 |
| 491–500 | 12,939 | 12,880 | +59 |
| 501–600 | 19,705 | 18,133 | +1,572 |
| 601–1,200 | 500 | 511 | –11 |
| Total | 229,100 | 231,533 | –2,433 |
Proportion of candidates by score band (as of August 3)
| CRS score range | Candidates | Cumulative | Percentile range | Share of pool |
|---|---|---|---|---|
| 0–300 | 7,683 | 7,683 | 0.00 % – 3.35 % | 3.35 % |
| 301–350 | 17,101 | 24,784 | 3.35 % – 10.82 % | 7.46 % |
| 351–400 | 50,107 | 74,891 | 10.82 % – 32.69 % | 21.87 % |
| 401–410 | 10,775 | 85,666 | 32.69 % – 37.39 % | 4.70 % |
| 411–420 | 11,326 | 96,992 | 37.39 % – 42.34 % | 4.94 % |
| 421–430 | 11,942 | 108,934 | 42.34 % – 47.55 % | 5.21 % |
| 431–440 | 13,267 | 122,201 | 47.55 % – 53.34 % | 5.79 % |
| 441–450 | 13,595 | 135,796 | 53.34 % – 59.27 % | 5.93 % |
| 451–460 | 14,845 | 150,641 | 59.27 % – 65.75 % | 6.48 % |
| 461–470 | 16,057 | 166,698 | 65.75 % – 72.76 % | 7.01 % |
| 471–480 | 16,368 | 183,066 | 72.76 % – 79.91 % | 7.14 % |
| 481–490 | 12,890 | 195,956 | 79.91 % – 85.53 % | 5.63 % |
| 491–500 | 12,939 | 208,895 | 85.53 % – 91.18 % | 5.65 % |
| 501–600 | 19,705 | 228,600 | 91.18 % – 99.78 % | 8.60 % |
| 601–1,200 | 500 | 229,100 | 99.78 % – 100.00 % | 0.22 % |
Percentiles indicate the proportion of candidates whose CRS score is at or below the upper limit of each band.
Draws not reflected in the August 3 snapshot
Two selection rounds held after the snapshot added 3,507 invitations:
| Date | Round type | Invitations issued | Lowest CRS score |
|---|---|---|---|
| August 4 | Provincial Nominee Program | 507 | 768 |
| August 5 | Canadian Experience Class | 3,000 | 516 |
Including these, the total number of Invitations to Apply (ITAs) issued through Express Entry to date stands at 108,123.
What drove the profile changes between July 19 and August 3?
IRCC conducted four draws in that period, issuing 7,515 ITAs:
| Date | Round type | Invitations issued | Lowest CRS score |
|---|---|---|---|
| July 20 | Provincial Nominee Program | 511 | 744 |
| July 21 | Canadian Experience Class | 2,000 | 516 |
| July 22 | French‑Language proficiency | 5,000 | 399 |
| July 23 | Skilled Military Recruits* | 436 | 8 |
*The July 23 draw was the first ever targeting Skilled Military Recruits, a category introduced in February 2026.
The combined effect of these draws and subsequent invitations reduced the overall pool size by 2,433 profiles.
How Express Entry works (brief overview)
- Eligibility – Candidates must qualify for at least one federal economic program (e.g., Federal Skilled Worker, Canadian Experience Class, Federal Skilled Trades).
- CRS score – Points are awarded for age, education, language ability, work experience, and other factors.
- Draws – IRCC runs regular invitation rounds, selecting the highest‑scoring candidates. Category‑based draws (e.g., French‑language, healthcare, trades, STEM) often have lower CRS cut‑offs because they target specific labour‑market needs.
- Processing – After receiving an ITA, candidates have 60 days to submit a permanent‑residence application. Typical processing time for Express Entry applications is about six months, compared with 12–20 months for base Provincial Nominee Program applications.
Recent category draws illustrate the range of CRS cut‑offs:
- Healthcare & social services – 462 – 476
- Canadian Experience Class (general) – 507 – 518
- Physicians with Canadian work experience – very low volume (271 invitations in the latest draw)
Understanding where a profile falls within the current distribution helps candidates gauge their likelihood of receiving an invitation and decide whether to improve language scores, obtain a provincial nomination, or explore other pathways.
Source article: www.cicnews.com