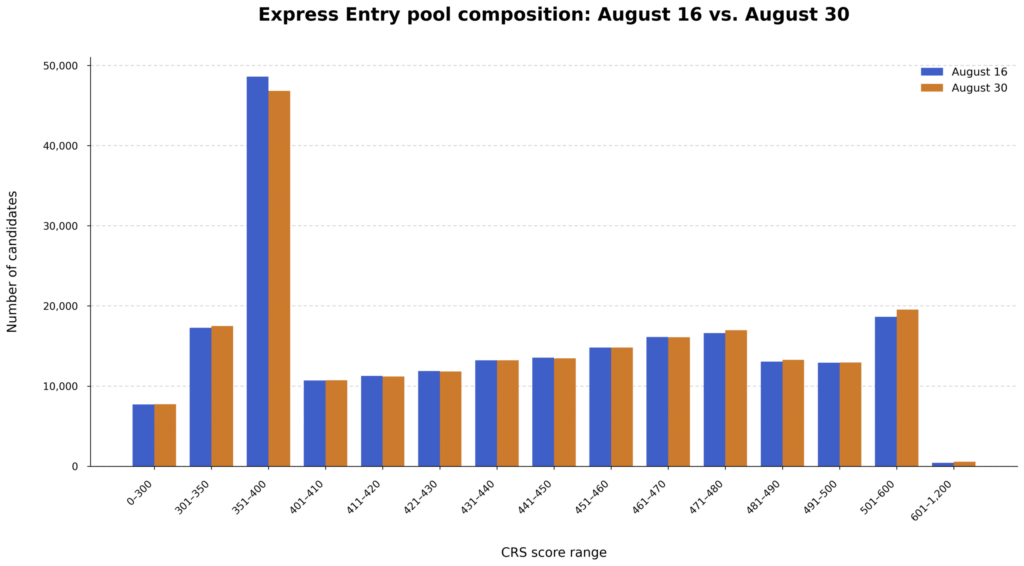
Canada’s immigration department released an updated snapshot of the Express Entry pool for 30 August 2026. The data show a marginal decline of 186 profiles since 16 August, a notable drop in the 351‑400 CRS band, and a rise in the number of high‑scoring candidates.
Pool composition – 16 August vs. 30 August 2026
| CRS score range | 30 Aug | 16 Aug | Difference |
|---|---|---|---|
| 0‑300 | 7,735 | 7,709 | +26 |
| 301‑350 | 17,495 | 17,269 | +226 |
| 351‑400 | 46,824 | 48,600 | –1,776 |
| 401‑410 | 10,723 | 10,688 | +35 |
| 411‑420 | 11,183 | 11,269 | –86 |
| 421‑430 | 11,811 | 11,890 | –79 |
| 431‑440 | 13,233 | 13,229 | +4 |
| 441‑450 | 13,463 | 13,555 | –92 |
| 451‑460 | 14,800 | 14,814 | –14 |
| 461‑470 | 16,099 | 16,133 | –34 |
| 471‑480 | 16,981 | 16,626 | +355 |
| 481‑490 | 13,273 | 13,066 | +207 |
| 491‑500 | 12,952 | 12,915 | +37 |
| 501‑600 | 19,542 | 18,657 | +885 |
| 601‑1,200 | 559 | 439 | +120 |
| Total | 226,673 | 226,859 | –186 |
Competitiveness of the pool (percentile ranges)
| CRS score range | Candidates | Cumulative | Percentile range | Share of pool |
|---|---|---|---|---|
| 0‑300 | 7,735 | 7,735 | 0.00 % – 3.41 % | 3.41 % |
| 301‑350 | 17,495 | 25,230 | 3.41 % – 11.13 % | 7.72 % |
| 351‑400 | 46,824 | 72,054 | 11.13 % – 31.79 % | 20.66 % |
| 401‑410 | 10,723 | 82,777 | 31.79 % – 36.52 % | 4.73 % |
| 411‑420 | 11,183 | 93,960 | 36.52 % – 41.45 % | 4.93 % |
| 421‑430 | 11,811 | 105,771 | 41.45 % – 46.66 % | 5.21 % |
| 431‑440 | 13,233 | 119,004 | 46.66 % – 52.50 % | 5.84 % |
| 441‑450 | 13,463 | 132,467 | 52.50 % – 58.44 % | 5.94 % |
| 451‑460 | 14,800 | 147,267 | 58.44 % – 64.97 % | 6.53 % |
| 461‑470 | 16,099 | 163,366 | 64.97 % – 72.07 % | 7.10 % |
| 471‑480 | 16,981 | 180,347 | 72.07 % – 79.56 % | 7.49 % |
| 481‑490 | 13,273 | 193,620 | 79.56 % – 85.42 % | 5.86 % |
| 491‑500 | 12,952 | 206,572 | 85.42 % – 91.13 % | 5.71 % |
| 501‑600 | 19,542 | 226,114 | 91.13 % – 99.75 % | 8.62 % |
| 601‑1,200 | 559 | 226,673 | 99.75 % – 100.00 % | 0.25 % |
Percentiles indicate the proportion of candidates whose CRS scores are at or below the upper limit of each band.
Draws not reflected in the 30 August snapshot
The snapshot excludes two draws that took place after 30 August:
| Date | Round type | Invitations issued | Lowest CRS score |
|---|---|---|---|
| 31 August | Provincial Nominee Program (PNP) | 562 | 697 |
| 1 September | Canadian Experience Class (CEC) | 2,000 | 521 |
Including these draws, Immigration, Refugees and Citizenship Canada (IRCC) has issued 117,427 ITAs through Express Entry in 2026, with 43.6 % going to CEC candidates.
Draws that contributed to the 16‑30 August changes
During the two‑week period, IRCC held three draws that together issued 6,442 ITAs:
| Date | Round type | Invitations issued | Lowest CRS score |
|---|---|---|---|
| 17 August | Provincial Nominee Program | 442 | 760 |
| 18 August | Canadian Experience Class | 1,000 | 523 |
| 19 August | French‑Language proficiency | 5,000 | 382 |
The 18 August CEC draw recorded the highest cutoff for that program in 2026.
How Express Entry works
- Eligibility – Candidates must qualify for at least one of three federal economic programs (Federal Skilled Worker, Federal Skilled Trades, or Canadian Experience Class).
- CRS scoring – Points are awarded for age, education, language ability, work experience, and other factors.
- Invitation rounds – IRCC periodically runs draws, selecting candidates based on CRS score or specific category criteria (e.g., French language, health‑care occupations). Category‑based draws often have lower cut‑offs than general draws.
- Processing times – After receiving an invitation, candidates have 60 days to submit a complete permanent‑residence application. Typical processing is about six months for standard Express Entry applications; Base Provincial Nominee Program applications have taken 12‑20 months recently.
- Outcome – Successful applicants receive a Confirmation of Permanent Residence (COPR) and can complete the landing process to become permanent residents of Canada.
These figures illustrate that, as of the end of August 2026, the majority of candidates (over 90 %) sit below a CRS score of 600, while the top 0.25 % hold scores above 600. The modest net decline in the pool suggests limited attrition, but the sharp drop in the 351‑400 band highlights ongoing movement of mid‑range profiles, likely driven by recent draws and candidate withdrawals.
Source article: www.cicnews.com